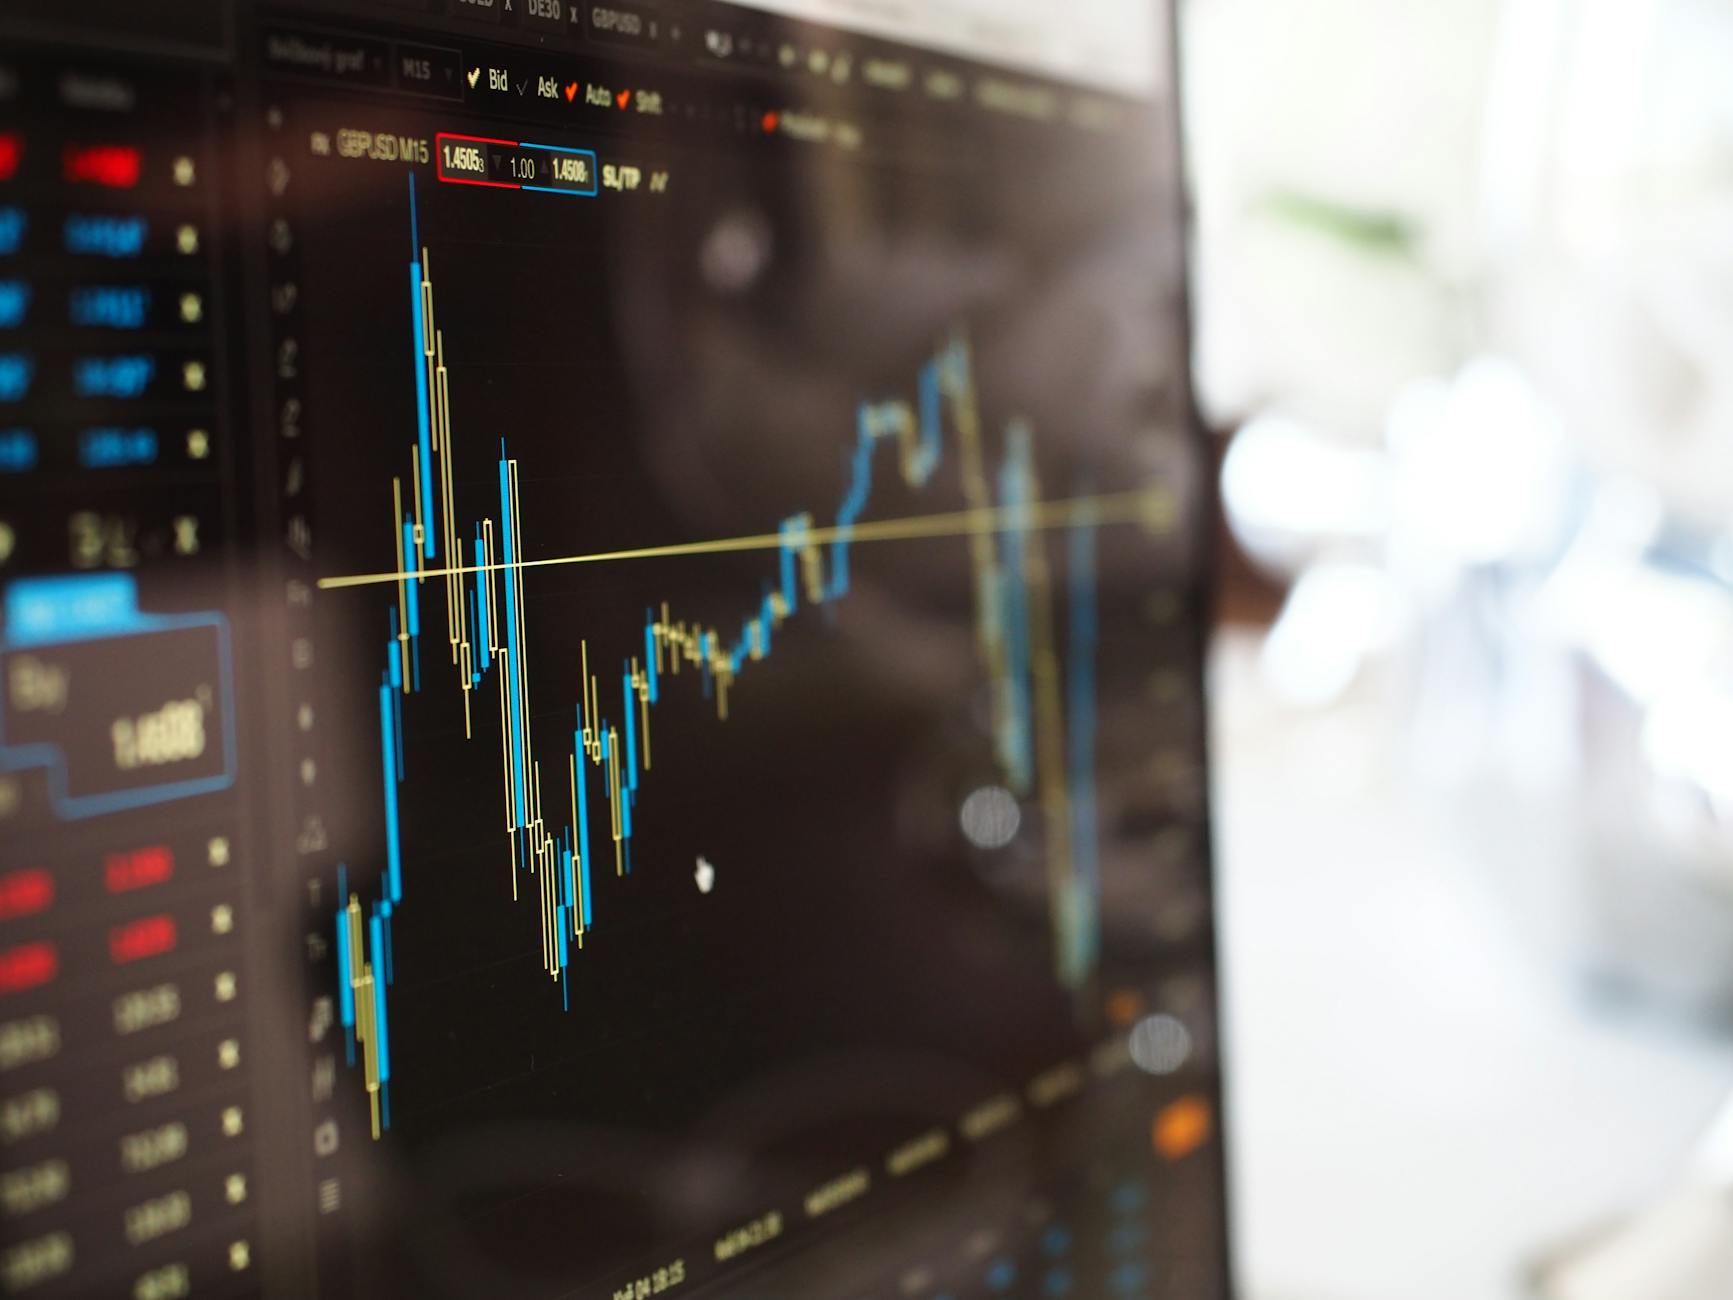
After seeing many comments on which is best software for charts, I thought this is the time for discussing about Trading view software and it's features.
If you are new to this software you can click this (LINK) and just have a look through it.
Now lets get to know about Trading View software in depth.
What is Trading View?
There are plenty of great charting and technical analysis software options available to traders and investors, but Trading View is among the best on the market today. Not only does it offer fantastic features like drawing tools, social sharing, community trading, and real-time charts, but the added flexibility of it being cloud-based allows you to access it across any device with an internet connection and your Trading View credentials. Anyone serious about trading or investing should definitely consider using Trading View as their charting software of choice! Here’s why...
Free real-time quotes
There’s a reason why 80% of traders use free, real-time market data: It works. With no platform fees, no subscription costs and zero ads on our charts, you get all of your information at one central location — your dashboard. And with access to hundreds of markets around the world, it’s safe to say you can find exactly what you’re looking for here. Mobile trading: You don’t have to be a full-time trader or stock market expert to appreciate mobile trading. As long as you have an internet connection, there are no limits on where and when you can trade using TradingView charts and tools.
Advanced data tools
You need a lot of data to make good investing decisions, and there are a number of tools available for getting that data. But how do you choose which one? If you’re looking for advanced capabilities with professional-grade tools, then TradingView—the world’s most popular trading platform—is your answer. You can create your own trade signals using custom indicators from technical analysis or pull in powerful data feeds with real-time analytics. And if you want to share information with other traders, then look no further than their social channels that support well over 500 markets around the globe. It’s like having a 24/7 stock broker at your fingertips!
Interactive charts
Charts come in all shapes and sizes, but there’s no denying that interactive charts are a great way to make your charts more interesting and easier to read. With drag-and-drop functionality, you can create professional-looking charts without needing advanced design skills. It also allows you to rearrange columns as well as change colors on-the-fly. When used effectively, customizing your chart makes it easier for investors to understand price action. In turn, they’ll be able to take better trading decisions and ultimately improve their investing performance. Even if you don’t have any design skills at all (like me), I recommend giving Interactive Charts a try - trust me, they're incredibly easy to use!
A large community of traders and investors
Even though you might have an account with a different exchange, I’m willing to bet that you already have an account with Coinigy—and if not, now would be a good time to make one. Trading View supports over 130 exchanges, including many of those listed above. Not only can you add multiple accounts on different exchanges, but it also integrates well with third-party tools like Google Sheets and Excel as well as API connections (for professional traders). Because Trading View supports so many exchanges and trading platforms, it’s often where I go when market data begins to lag.
It’s easy to create charts in Trading View
All you need to do is enter your desired ticker symbol and click Create Chart. You can use a wide variety of technical indicators, drawing tools, or other advanced options. The advanced options are incredibly useful for professional traders—they have much more freedom to customize their charts than they would on most other platforms. Just take a look at some of these other features
Works with any device
No matter what device you’re using, Tradingview has a free version that supports it. Whether you’re checking your portfolio on an iPhone, or conducting complex back-tests on your home computer, Tradingview makes sure you can see exactly what you need to at all times. And if there are certain features—like detailed metrics and indicators—you want to use without paying for them, that’s possible too. You can start out by viewing charts for free, then pay $15 a month (or much less if you pay annually) to unlock everything else.(LINK)


Comments
Post a Comment